How Power BI helps the NHS

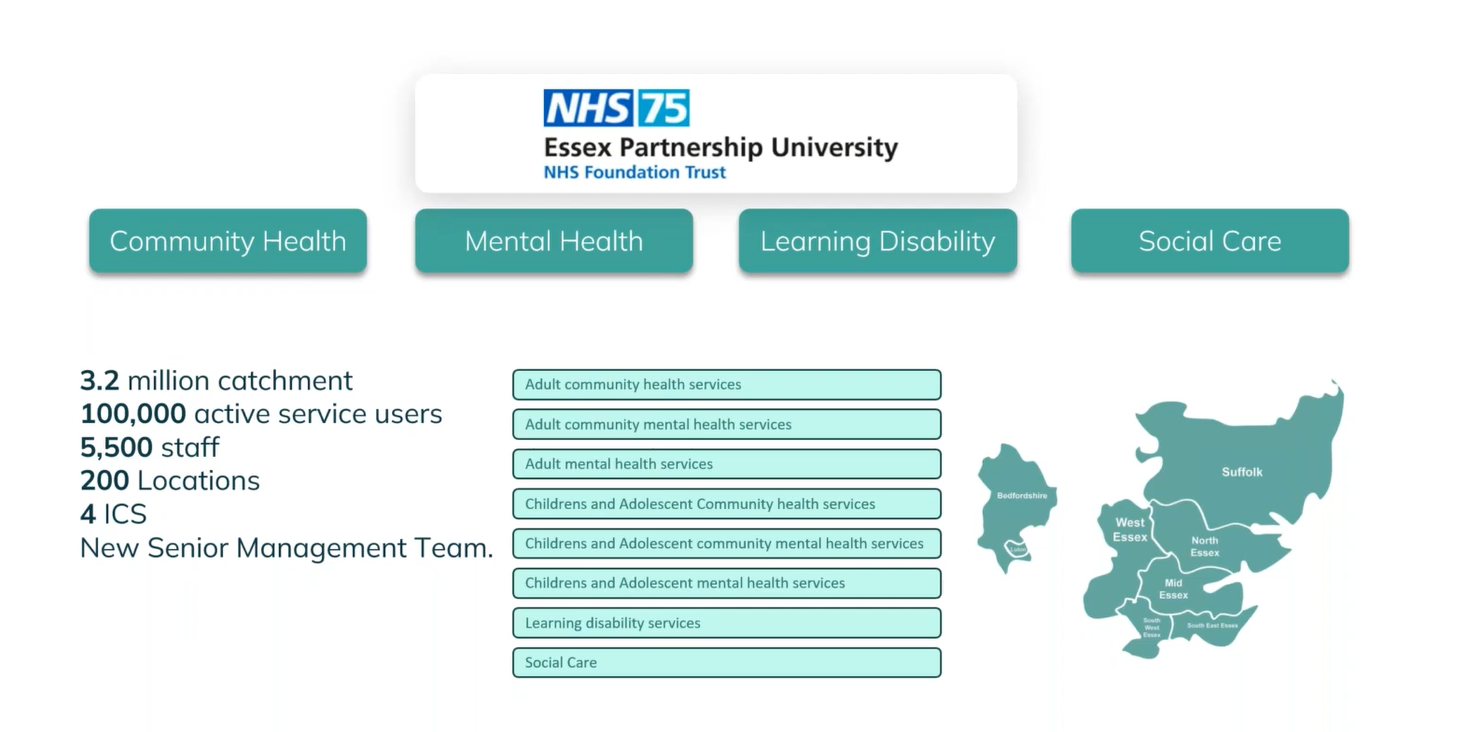
Managing increasing demand, hear how Essex Partnership University NHS Foundation Trust (EPUT) now have the ability to follow action to impact. 

Addressing the mental health crisis

Learn how EPUT responded to the 'rapid review into data on mental health impatient settings report'. 

Recording of our case study speaking slot at the Covenzis 'Addressing the Mental Health Crisis National Conference: Managing increasing demand'

Overview EPUT 2023-11-27 171249

Essex Partnership University NHS Foundation Trust (EPUT)

How Trustmarque supported the Trust to transform the way they work using data!

Recording of our case study speaking slot at the Covenzis NHS Data and Information Virtual Conference series.

industry-healthcare

Dynamic Board report transforming a 200-page static report covering 158 KPIs

"Previous data presented in Q&S meeting was done so off the back of a report pulled for commissioners and was not Care Unit/Speciality specific and was thus out of date the second it was published. The new Safety Dashboard allows for specificity of services and Care Units and looks at emerging themes in that month via the bar chart of sorts in the dashboard."

Kerri Mackay
Deputy Director, Quality & Safety – Mid and South Essex Community Delivery

"I was very impressed with the patient safety dashboard. As TASID lead, access to data in this format, particularly around restraint/restrictive practice is essential."

Mark Palmer
TASID Lead

"Previously we would have to wait for a month+ to receive data but having data at fingertips is fantastic and is an innovative way forward 

In Services operational meetings, they can now have immediate access to the data instead of waiting for outdated data."

Vijay Chattoo
Deputy Director for Quality and Safety -  Specialist Services
“We are drowning in data but starving for information, we know we have a gap in capability but need help to understand it and support to fix it.”
Adam Whiting, Deputy Chief Information Officer, EPUT

Power BI use cases and live dashboards

With many trusts already utilising the NHS central tenant and often already have a deep integration with other Microsoft technologies, an obvious technical solution for reporting is Microsoft Power BI.
Power BI connects disparate data sources enabling users to consolidate data into dynamic dashboards, that can be accessed from board to ward

home-healthcare
Essex Partnership NHS Foundation Trust

Dynamic Board report transforming a 200-page static report covering 158 KPIs

View dashboard
home-governement
Manchester City Council

Public facing dashboard to census data

View dashboard
industries-we-empower
Local Council Children's Service Analysis

Organisation with  91 complex KPIs relating to vulnerable children.

View dashboard

Are you experiencing:

tm-transform-healthcare-icons-01
Cumbersome and static reporting practices?

tm-transform-healthcare-icons-02
Staff frustration due to analytic barriers and impossible reporting?

tm-transform-healthcare-icons-03
High levels of reporting scrutiny from boards?

tm-transform-healthcare-icons-04
A constant cycle of manually cutting and pasting to produce static monthly reports?

tm-transform-healthcare-icons-07
Never-ending tasks in the hunt for useful data insights?

tm-transform-healthcare-icons-06
Lack of governance due to poor insights?

tm-transform-healthcare-icons-07
Delivery of infrequent and late reports?

Free assessment

Dynamic data

Your NHS trust could be spending valuable time and resources to produce insightful reports. Trustmarque can help you build and roll-out complex reports and dynamic dashboards replacing stagnant documents, built on Microsoft Power BI. We can ease the burden of data and giving you actionable patient insight.

Benefits of dynamic data

  • Cost-effective licensing
  • Frameworks can be duplicated for future projects.
  • Connect to a wide range of data sources, including databases, spreadsheets, cloud services, and online services e.g. Excel, SQL server, Azure data services, SharePoint, Salesforce etc.
  • Clean, reshape, and combine data from multiple sources.
  • User-friendly, drag-and-drop interface for building reports and dashboards.
  • Add visuals like charts, tables, maps, and custom visuals.
  • Wide variety of visualisation options to represent your data effectively.
  • Schedule data refreshes to keep your reports up to date.
  • Cloud-based platform for sharing and collaboration, share reports with specific individuals or groups and control access.
  • Control access to data and manage user permissions.
  • Data can be protected through role-level security and row-level security to ensure sensitive information is only accessible to authorised users.

Unlock data potential

Book your free assessment

TM - Electric yellow - logo mark - outlined